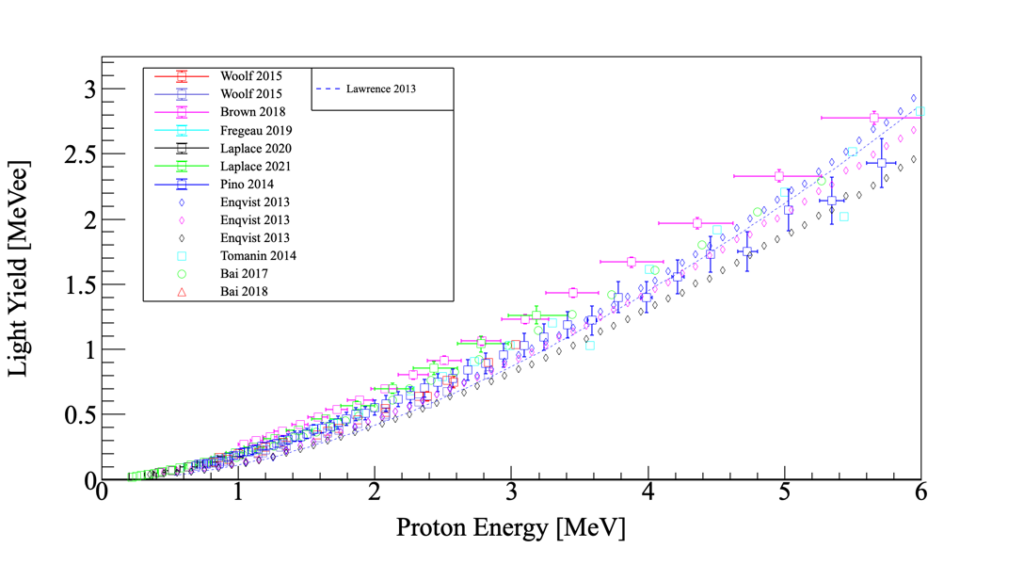
EJ-309 relative light yield in MeVee as a function of proton energy from 0.2 to 6 MeV. The discrepancy between the different reported proton light yield measurements can be explained in part by differences in the integration lengths used to measure the light output [Brown2018JourApplPhys124, Laplace2020NIMA959], bias associated with characterization of the Compton edge used for light output calibration [Dietze1982NIMA193], and bias associated with the edge characterization method used by some authors [Weldon2020NIMA953]. Most often ignored, non-proportionality of the electron light yield [Payne2011IEEE58, Swiderski2012JINST7] may also introduce further biases in calibration/conversion to the MeVee light unit. In some cases, fit functions provided by the authors are shown in lieu of the original measurements due to challenges in extracting data points from the published graphs.
Additional quenching data are available at higher proton energies and for different recoil particles in the table below. Click the cells in the Reference column to view the paper from which the data is derived. The Data column will direct to a downloadable text file of the quenching data.
You can find a complete documentation of the Reference Papers and values when you Click Here.
| Reference Paper | Particle | Energy Range (MeV) Low Bin | Energy Range (MeV) High Bin | Data Text File |
|---|---|---|---|---|
| Bai 2017 | Proton | 0.83 | 5.27 | Click Here |
| Brown 2018 | Proton | 1 | 20 | Click Here |
| Fregeau 2019 | Proton | 3.6 | 45 | Click Here |
| Laplace 2020 | Proton | 0.2 | 3.2 | Click Here |
| Laplace 2021 | Proton | 0.3 | 1 | Click Here |
| Norsworthy 2017 | Proton | 1.15 | 5.15 | Click Here |
| Takada 2010 | Proton | 5.8 | 70 | Click Here |
| Tomanin 2014 | Proton | 0.4 | 14 | Click Here |
| Enqvist 2013 | Proton | 3.6 | 45 | Click Here |
| Woolf 2015 | Proton | 0.8 | 2.8 | Click Here |
| Lawrence 2013 | Proton | 0.5 | 15 | Click Here |
| Pino 2014 | Proton | 0.54 | 8.2 | Click Here |
| Takada 2010 | Deuteron | 14.5 | 48 | Click Here |
| Takada 2010 | Alpha | 13.8 | 90 | Click Here |
| Laplace 2021 | Carbon Ion | 1.8 | 5 | Click Here |
| Norsworthy 2018 | Carbon Ion | 2.8 | 3.9 | Click Here |
